

Homebuyer reviewing mortgage rates and loan offers at a desk
Average Home Loan Interest Rate Guide

Getting a mortgage? The rate you'll pay determines whether you hand lenders an extra $50,000 or keep that money in your pocket over the loan's lifetime. While you'll see plenty of headlines about "average" rates, that number won't necessarily match what lenders quote you. Here's what's really happening with home loan rates right now, how these benchmarks actually work, and practical ways to beat the published numbers.
Current Average Rates for Home Loans: What You'll Actually See
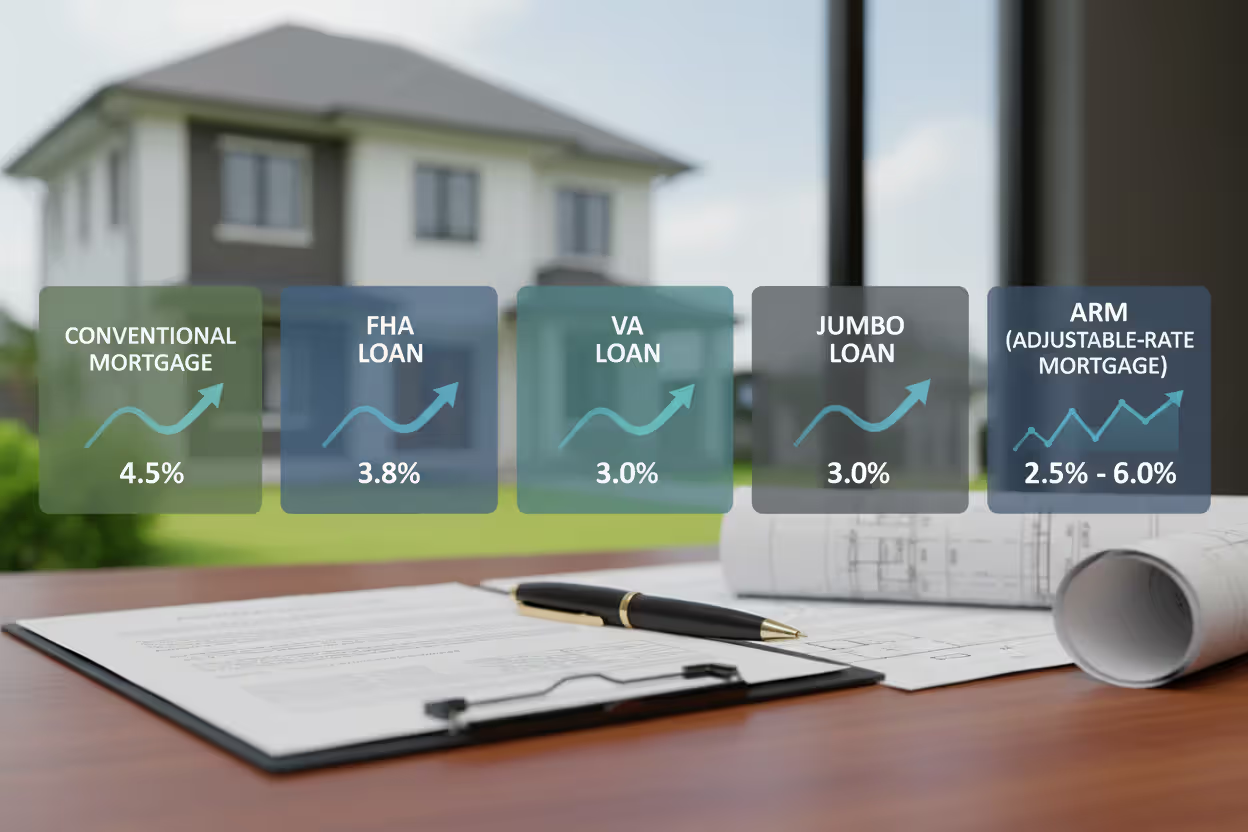
Right now in March 2026, you're looking at roughly 6.48% for a standard 30-year conventional mortgage. The 15-year version? About 5.73%. We've finally seen things settle down after the chaos of 2022-2025, when rates shot up from below 3% to nearly 8%, then gradually eased back.
If you're considering an FHA loan—those government-backed mortgages that let you put down as little as 3.5%—you're looking at around 6.21% for 30 years. Sounds better than conventional, right? Here's the catch: you'll pay mortgage insurance that adds roughly 0.85% to your annual costs, which wipes out most of that rate advantage.
Veterans and active military members get the best deal through VA loans at 5.94% on average. Zero down payment required, no monthly mortgage insurance, and you're getting a rate that beats almost everything else available. The catch? You'll pay a one-time funding fee of about 2.15% of your loan amount, though you can roll that into the mortgage.
Need to borrow more than $806,500 (the conforming loan limit for most counties)? Welcome to jumbo loan territory, where rates average 6.72%. Lenders charge more because these loans can't be sold to Fannie Mae or Freddie Mac, leaving them holding more risk.
Then there are adjustable-rate mortgages. A 5/1 ARM—fixed for five years, then adjusting annually—currently starts around 5.87%. You're gambling that you'll either sell or refinance before that first adjustment hits. Sometimes that works out beautifully. Sometimes it doesn't.
Week to week, you might see rates bounce around by 0.10% to 0.25%. Monday's quote can look very different by Thursday, depending on what's happening with inflation data, job reports, or Federal Reserve commentary.
Author: Brandon Kingswell;
Source: isomfence.com
Understanding How These Rate Benchmarks Actually Get Calculated
Ever wonder where those "average" numbers come from? Freddie Mac runs what they call the Primary Mortgage Market Survey—the most quoted source in the industry. Every Thursday, they survey about 80 lenders nationwide, asking what they'd charge a borrower with excellent credit (740+ score) and a 20% down payment.
Bankrate takes a different approach, surveying lenders daily across all 50 states. The Mortgage Bankers Association publishes weekly data based on actual applications, not just rate quotes. So you've got three major sources, each using different methods, often showing different results.
Here's what matters: Freddie Mac's survey assumes you're basically a dream borrower. Most people don't have 740+ credit scores and 20% sitting around for a down payment. Real borrowers typically see rates that run 0.25% to 0.50% higher than the published averages.
Geography plays a bigger role than most people realize. California and Texas lenders compete aggressively, often offering rates 0.15% below what you'd see in Montana or Wyoming. National averages smooth out these regional differences completely.
The Federal Housing Finance Agency publishes monthly data showing what borrowers actually paid on closed loans that Fannie and Freddie purchased. This benchmark home loan rate overview lags by 30-45 days, but it reflects reality rather than advertising. There's usually a gap between what gets quoted and what people actually pay.
Some borrowers buy down their rate by paying points upfront. Others accept higher rates to avoid closing costs. Published averages mix both strategies together, which can make typical home loan rates hard to pin down precisely.
Why Your Rate Might Be Nothing Like the Published Average
That mean mortgage borrowing rate you see in headlines? It's a midpoint on a very wide spectrum. A borrower with a 620 credit score and 5% down might pay 1.5 percentage points more than someone with an 800 score and 30% down—same lender, same day, completely different rates.
Lenders feed your information into risk-based pricing models that consider dozens of variables. Buying a single-family home you'll live in? Great, lowest rates. Investment property condo? Expect to pay significantly more. Your debt-to-income ratio matters. So does how long you've been at your job and whether you have cash reserves beyond your down payment.
Then there's lender markup—the discretionary profit margin each institution adds. One bank might excel at VA loans and price them aggressively while being mediocre on jumbo loans. Another might be the opposite. This variation explains why shopping around consistently saves borrowers real money.
How Much Your Credit Score Really Costs You
Your credit score functions like a pricing dial that lenders twist up or down. Someone with a 760 score might pay half a percentage point less than a 680 score borrower, everything else identical. On a $400,000 mortgage, that's roughly $100 per month—or $36,000 over 30 years.
The pricing doesn't move in a straight line, either. Jumping from 620 to 640 might save you 0.75%, while improving from 740 to 760 only shaves off 0.125%. You get the biggest gains by crossing certain thresholds: 620 (minimum for many conventional loans), 680 (where pricing improves substantially), and 740 (typically qualifying you for premium rates).
Your FICO score isn't the only thing lenders examine. They're looking at credit utilization—how much of your available credit you're using. They check for recent inquiries, late payments, collections, and how long you've had your accounts open. A 720 score with maxed-out credit cards might get worse pricing than a 700 score with low balances and five years of perfect payments.

Author: Brandon Kingswell;
Source: isomfence.com
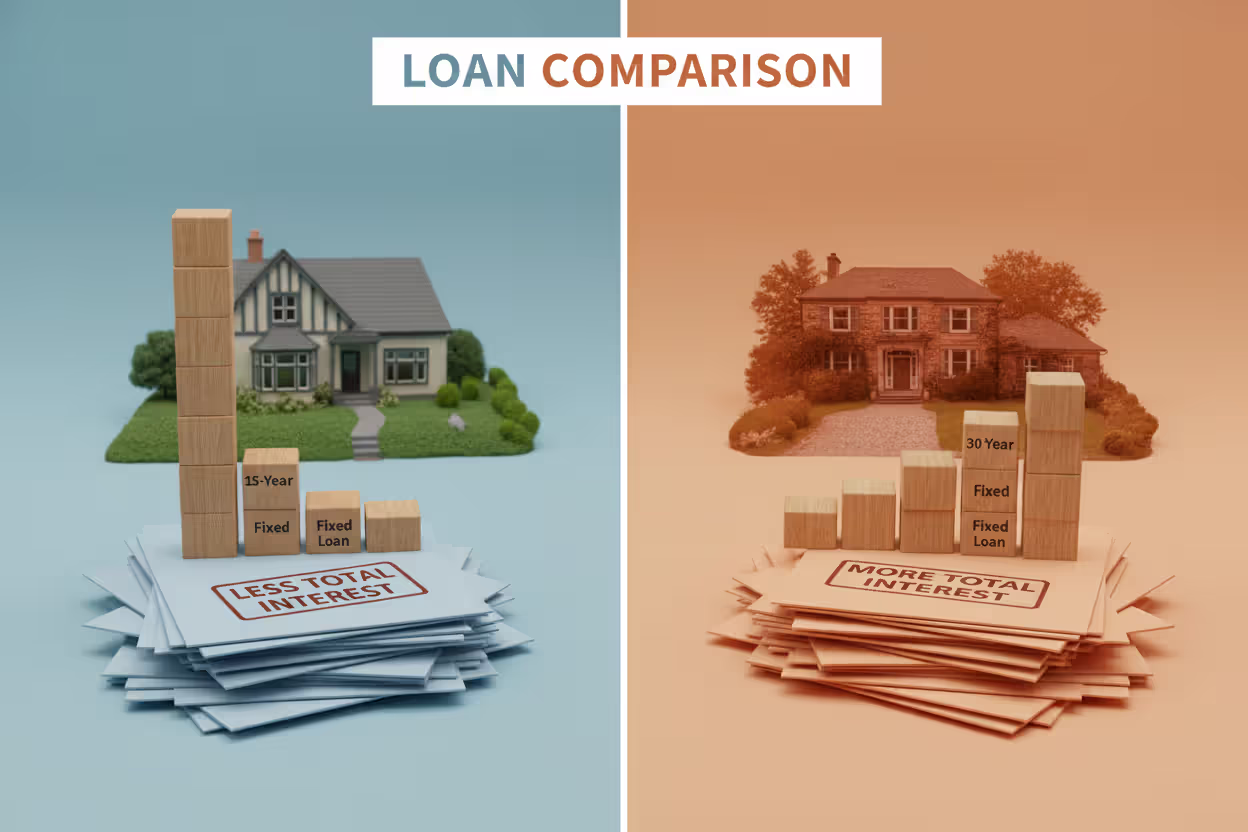
The Trade-Off Between Loan Length and Rate
Want a lower rate? Choose a shorter term. It's that simple. Right now, the gap between 30-year and 15-year conventional loans sits at 0.75 percentage points, actually wider than the typical 0.50% spread we see historically. Lenders prefer shorter loans when economic uncertainty is higher.
That 15-year loan at 5.73% means a higher monthly payment than a 30-year at 6.48%—no way around that. But the total interest you'll pay drops dramatically. Borrow $350,000, and the 15-year option costs about $750 more per month but saves roughly $178,000 in interest by the time you're done.
ARMs offer even lower starting rates with strings attached. That 5/1 ARM at 5.87% saves you money compared to 6.48% for the first five years, but what happens after year five? Your rate adjusts based on market conditions then. Confident you'll sell or refinance within five years? ARMs make sense. Planning to stay put long-term? That fixed-rate predictability matters more.
Author: Brandon Kingswell;
Source: isomfence.com
How Home Loan Rates Have Moved Over the Past Five Years
The last five years? Honestly, they've been wild. Early 2021 saw 30-year fixed rates bottom out at 2.65%—an all-time low driven by Federal Reserve emergency pandemic measures. By October 2023, we'd rocketed up to 7.79%, the highest level since 2000. The Fed was slamming the brakes on inflation with aggressive rate hikes.
Things have calmed down through 2024 and 2025. Inflation cooled off, the Fed stopped hiking, and mortgage rates drifted down to the mid-6% range where we are now. Most economists expect rates to hang out somewhere between 6.0% and 7.0% through the end of 2026, barring any major economic surprises.
| Time Period | 30-Year Fixed | 15-Year Fixed | 5/1 ARM | What Was Happening |
| Q1 2022 | 3.92% | 3.15% | 2.98% | Fed starts raising rates |
| Q1 2023 | 6.73% | 5.99% | 5.44% | Regional bank failures spook markets |
| Q1 2024 | 6.94% | 6.28% | 5.82% | Inflation stays stubbornly high |
| Q1 2025 | 6.58% | 5.81% | 5.91% | Fed signals it's done hiking |
| Q1 2026 | 6.48% | 5.73% | 5.87% | Economy stabilizes, rates plateau |
Federal Reserve policy drives the big trends, but mortgage rates don't simply copy the Fed's moves. The Fed controls overnight bank-to-bank lending rates. Mortgage rates track 10-year Treasury bonds more closely. When investors expect economic growth and inflation, Treasury yields climb, pulling mortgage rates up with them. Recession fears? The opposite happens.
The 2020-2021 period was unusual because the Fed bought billions in mortgage-backed securities every month, artificially pushing rates down. When those purchases stopped in 2022, rates jumped hard—even before the Fed's first rate hike. These average rate trends for home loans reflect multiple forces working together, not just one policy lever.

Author: Brandon Kingswell;
Source: isomfence.com
Breaking Down Rates by Specific Loan Program
Different loan types serve different buyers, and their rates reflect varying risk levels and government backing.
Conventional 30-year fixed mortgages dominate the market at about 65% of all home loans. That current 6.48% benchmark assumes good credit and 20% down. Put down less than 20%? You'll pay private mortgage insurance (PMI), which doesn't change your interest rate but does increase your monthly bill.
Conventional 15-year fixed loans at 5.73% attract borrowers who can handle higher payments in exchange for building equity faster and paying less interest overall. People choosing 15-year terms typically earn more and have higher net worth than the average 30-year borrower.
FHA 30-year loans at 6.21% work for buyers who can only manage 3.5% down or have credit scores in the 580-620 range (sometimes as low as 500 with 10% down). The rate looks better than conventional with similar down payments, but mandatory mortgage insurance premiums add 0.85% annually to your loan balance, eating up most of that rate benefit.
VA loans at 5.94% combine low rates with incredible flexibility for eligible borrowers. Zero down payment, no PMI, lenient credit standards. The typical funding fee runs 2.15% of your loan amount for first-time users, but you can finance it into the mortgage rather than paying cash at closing.
USDA loans for properties in rural and suburban areas average 6.08% with zero down required for eligible buyers in qualifying locations. Income caps restrict who can use these loans, and you'll pay a 1% upfront guarantee fee added to your loan amount.
Jumbo 30-year loans at 6.72% demand excellent credit (usually 720 minimum) and larger down payments (often 20-30% or more). Some lenders will match or beat conventional rates for borrowers with exceptional profiles—think 800+ credit scores, 30%+ down, and six months of reserves in the bank.
5/1 ARMs at 5.87% offer the lowest initial rate but come with adjustment risk after five years. The rate adjusts based on an index plus a margin, with caps limiting increases (typically 2% per adjustment period, 5% over the loan's lifetime). You need to be prepared for potentially higher payments down the road.
Strategies to Secure Rates Below Published Benchmarks
The average home loan interest rate tells you what most borrowers pay, but informed shoppers routinely beat those numbers. Rate shopping alone typically saves 0.25% to 0.50%—that's $50 to $100 monthly on a $400,000 loan, or $18,000 to $36,000 over the full term.
Get quotes from at least three different lender types: a big national bank, a local credit union, and an online lender. Banks offer convenience and possible relationship discounts if you already bank there. Credit unions frequently offer below-market rates to members. Online lenders operate with minimal overhead and can price aggressively. A mortgage broker shops multiple lenders for you, earning compensation through lender-paid fees or borrower-paid points.
Timing your lock matters more than you'd think. Rates jump around daily based on economic data releases and market sentiment. Lock on a day when the stock market tanks or unemployment ticks up? You'll often snag better rates than on days when markets are celebrating. That said, trying to perfectly time the market rarely works—when you find a rate you can live with, locking it brings peace of mind.
Should you pay points to reduce your rate? One point costs 1% of your loan amount and typically cuts your rate by 0.25%. On a $400,000 loan, you're paying $4,000 upfront to save roughly $60 monthly. The math works in your favor after month 67. Planning to move or refinance within five years? Skip the points and keep your cash.
Improving your financial profile before applying can dramatically change what lenders offer you. Pay credit card balances down below 30% utilization. Fix errors on your credit report. Save for a bigger down payment. Even waiting 2-3 months to boost your score from 695 to 720 might cut your rate by 0.375%.
Don't overlook smaller regional banks and local lenders trying to build market share. A community bank working to grow its mortgage portfolio might undercut national lenders by 0.25% or more. The trade-off? Potentially clunkier technology and longer processing times, but the savings can justify the hassle.
Too many borrowers obsess over timing the market perfectly. The real difference between an average rate and a great one usually comes down to preparation—cleaning up your credit, getting your paperwork organized, and actually shopping multiple lenders instead of just going with the first quote
— Sarah Martinez
Common Questions About Home Loan Interest Rates
The average home loan interest rate gives you a useful starting point for understanding today's mortgage market, but your personal rate depends on dozens of factors specific to your financial situation and the lender you choose. Here in early 2026, rates have settled into the mid-6% range for conventional 30-year mortgages after years of wild swings, though you'll see substantial variation across different loan types and borrower profiles.
Smart borrowers use published averages as a reference point, not a final answer. They understand the methodology behind how these benchmarks get calculated, recognize which factors influence their individual rate, and actively compare multiple lenders to find financing that beats the mean. Small rate differences compound into serious money over time—just 0.25% better on a $400,000 loan saves about $60 monthly and $21,600 over three decades.
Today's rate environment rewards preparation above all else. Boost your credit score, save for a larger down payment, and learn the trade-offs between different loan types and terms—all of this contributes to securing better financing. Whether you're buying your first home or refinancing an existing mortgage, understanding how average rates work and what shapes your personal rate puts you in the strongest position to make a smart decision that saves you money for years to come.
Related Stories

Read more

Read more


The content on this website is provided for general informational and educational purposes only. It is intended to explain concepts related to home loans, mortgage rates, home equity loans, and the home buying process.
All information, including articles, guides, and explanations, is provided for general educational purposes only. Mortgage terms, interest rates, eligibility requirements, and lending conditions may vary depending on individual financial situations, lenders, and regional regulations.
This website does not provide financial, legal, or mortgage advice, and the information presented should not be considered a substitute for consultation with qualified financial professionals, lenders, or advisors.
The website and its authors are not responsible for any errors or omissions, or for any decisions made based on the information provided on this website.